

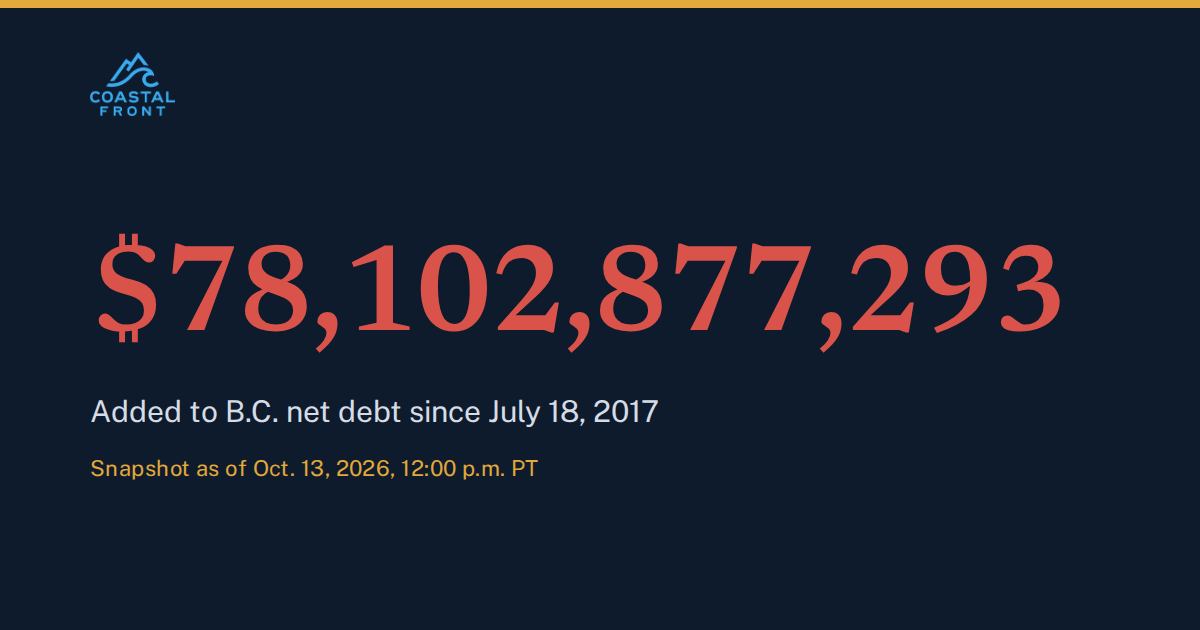
At the current pace, B.C.’s net debt is growing by about $713 every second, or $62 million a day. Coastal Front’s clock counts every dollar of growth since the BC NDP took office on July 18, 2017, across both John Horgan’s and David Eby’s time as premier.
The numbers at a glance as of Oct. 13, 2026
Net debt when the NDP took office: $39 billion
Net debt today: $118 billion
Increase since 2017: 198%
Growth rate: $713 every second
How we calculate it
Net debt is the province’s total liabilities minus its financial assets, the same measure the B.C. government uses to report its own debt. We start the clock at zero on July 18, 2017, and count the increase from there. The live rate comes from the growth forecast in Budget 2026, from about $106 billion on March 31, 2026, to about $128 billion by March 31, 2027. That includes all net debt growth, including borrowing for hospitals, schools and transit, not only operating deficits.
Real borrowing does not happen at an even pace, so the live figure is an estimate. The September 2026 quarterly update raised the deficit forecast by about $450 million, so the true figure may run slightly higher.
Sources
Department of Finance Canada, Fiscal Reference Tables; B.C. Budget and Fiscal Plan 2026/27 to 2028/29; CBC News, July 18, 2017.